Where My Hogs At?
Comparatively speaking, was Georgia’s offensive line as inferior as perceived?
By Patrick Garbin—Twitter @PGarbinDT
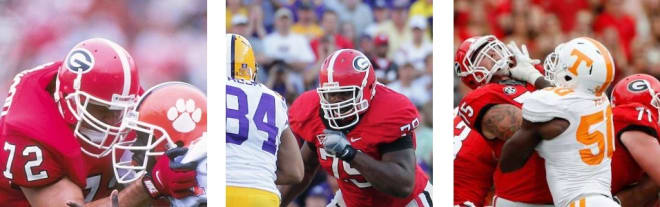
The Bulldogs’ offensive line: It was considered a weakness last season and, although presumably improved, is an area of concern for the 2017 campaign. Still, how actually inferior was Georgia’s line play in 2016—at least, comparatively speaking?
Featured by a number of media outlets, including The New York Times, the “Hog Index” originally was an NFL comparative measurement for offensive line performance. I tweaked the index a tad to where a college team's offensive line ranking can be determined by its average of three rankings in comparison to the other teams being measured: a) yards per rush (sacks omitted); b) negative pass-play percentage, or the percent of passing plays (pass attempts + times sacked) resulting in an interception or sack; and c) third- and fourth-down combined conversion rate.
Now, I’m aware that some may argue why one of, if not all three, aforementioned calculations don’t adequately measure an offensive line’s performance. Notwithstanding, if there’s a better way to comparatively evaluate offensive line play, I seriously would be interested in hearing about it.
Yet, for what it’s worth, the Hog Index reveals that when compared to the rest of the SEC, Georgia’s offensive line in 2016 actually wasn’t too shabby. Although the Bulldogs’ 5.17 yards-per-carry average ranked 10th in the conference, their 8.05 negative pass-play percentage was 6th, whereas their 42.51 third and fourth-down rate was a lofty 3rd. Considering the individual rankings of 10th, 6th, and 3rd, Georgia’s average of 6.33 ranked 7th in the 14-member league:
| Rank) Team | Yards-per-carry average | Negative pass-play percentage | Third- and fourth-down combined conversion rate | Avg. of three |
|---|---|---|---|---|
|
1) Alabama |
3rd |
4th |
1st` |
2.67 |
|
2) Missouri |
9th |
1st |
2nd |
4.00 |
|
3) Texas A&M |
2nd |
2nd |
11th |
5.00 |
|
t-4) Auburn |
6th |
7th |
4th |
5.67 |
|
t-4) LSU |
1st |
8th |
8th |
5.67 |
|
t-4) Miss. State |
5th |
3rd |
9th |
5.67 |
|
7) Georgia |
10th |
6th |
3rd |
6.33 |
|
8) Ole Miss |
12th |
5th |
6th |
7.67 |
|
9) Kentucky |
4th |
14th |
6th |
8.00 |
|
10) Tennessee |
7th |
9th |
12th |
9.33 |
|
11) Florida |
14th |
10th |
5th |
9.67 |
|
12) Arkansas |
8th |
13th |
10th |
10.33 |
|
13) Vanderbilt |
11th |
11th |
14th |
12.00 |
|
14) S. Carolina |
13th |
12th |
13th |
12.67 |
Rather surprised at the result above, I thought I would figure Georgia’s 2016 Hog Index compared to other Bulldog teams as far back as possible. Beginning in 1994, or when the school first made opponent sacks readily available, I discovered Georgia’s 5.17 ypc, 8.05 npp, and 42.51 3rd-and-4th rate ranked 5th, 14th, and 10th, respectively, for an average of 9.67, ranking the Bulldogs’ offensive line performance last year tied for 9th over the last 23 seasons.
The top and bottom five Georgia offensive lines in regards to Hog Index:
| TOP 5 | YPC | NPP | 3rd-4th Rate | Avg. of three | (L to R) Starters |
|---|---|---|---|---|---|
|
1) 2014 |
1st |
6th |
1st |
2.67 |
John Theus, Jr.; Brandon Kublanow, So.; David Andrews, Sr.; Greg Pyke, So.; Kolton Houston, Jr. |
|
2) 2007 |
10th |
3rd |
5th |
6.00 |
Trinton Sturdivant, Fr.; Chris Davis, Fr.; Fernando Velasco, Sr.; Clint Boling, Fr.; Chester Adams, Sr. |
|
3) 2013 |
6th |
9th |
6th |
7.00 |
Kenarious Gates, Sr.; Dallas Lee, Sr.; David Andrews, Jr.; Chris Burnette, Sr.; John Theus, So. |
|
t-4) 1994 |
4th |
1st |
17th |
7.33 |
Adam Meadows, So.; Steve Roberts, Sr.; Scott Brownholtz, Sr.; Resty Beadles, So.; Troy Stark, Jr. |
|
t-4) 2008 |
9th |
2nd |
11th |
7.33 |
Clint Boling, So.; Cordy Glenn, Fr.; Ben Jones, Fr.; Chris Davis, So.; Justin Anderson, Fr. |
|
BOTTOM 5 |
YPC |
NPP |
3rd-4th Rate |
Avg. of three |
(L to R) Starters |
|
23) 1996 |
21st |
21st |
22nd |
21.33 |
Adam Meadows, Sr.; Resty Beadles, Sr.; Brad Stafford, Jr.; Antonio Fleming, Jr.; Matt Stinchcomb, So. |
|
t-21) 2000 |
23rd |
13th |
16th |
17.33 |
Jonas Jennings, Sr.; Brady Pate, Sr.; Curt McGill, Jr.; Kevin Breedlove, So.; Jon Stinchcomb, So. |
|
t-21) 2006 |
18th |
20th |
14th |
17.33 |
Ken Shackleford, Sr.; Fernando Velasco, Jr.; Nick Jones, Sr.; Chester Adams, Jr.; Daniel Inman, Sr. |
|
t-19) 1998 |
13th |
18th |
20th |
17.00 |
Matt Stinchcomb, Sr.; Steve Herndon, Jr.; Miles Luckie, Jr.; Jonas Jennings, So.; Chris Terry, Sr. |
|
t-19) 2003 |
19th |
23rd |
9th |
17.00 |
Daniel Inman, Fr.; Josh Brock, So.; Russ Tanner, So.; Bartley Miller, So.; Max Jean-Gilles, So. |
Again, an “index” which may be deemed meaningless by some, to me, actually exhibits that Georgia’s 2016 offensive linemen—whose Hog Index ranked in the top half of the SEC, and in the top 40 percent compared to previous Bulldog teams—were perhaps better than perceived by most. Therefore, if this season’s offensive line is presumably even better than before, perhaps the Dogs’ Hogs are in for a stellar 2017.