When “Hidden Yardage” has defeated the Dawgs…
By Patrick Garbin—Twitter @PGarbinDT
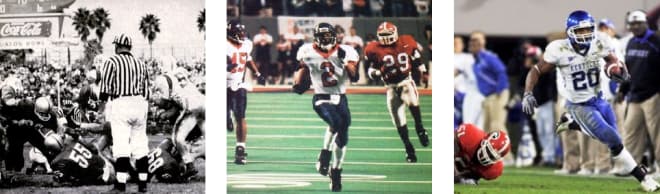
Pat’s Weekly Stat (you likely won’t see anywhere else): Sitting in the press box looking over the final statistics following Georgia’s 17-16 loss to Vanderbilt, something that really jumped out at me was the Bulldogs’ advantage in total yardage (421 to 171). I was so awestruck, I nudge the guy next to me and declared, “Surely, that’s never happened before in UGA football history—a yard differential of as much as +250 in Georgia’s favor, yet a loss!” He responded with only a look as to say, “Surely, you’re the biggest nerd on earth right now…”
Although, perhaps his look was saying, “Surely, there has been a bigger differential than that in defeat." And, he would be correct; there has been one—literally.
I went back and looked at every Georgia loss—all 267 of them—since the beginning of the Bulldogs’ modern era of football (i.e., since the end of WWII). I found that Georgia’s loss to Vanderbilt on Saturday was only the 18th time the Bulldogs had a yard differential of at least +100 resulting in a defeat—that’s one such loss every four seasons, or every 15 defeats. The eight games whereby Georgia had at least 150 more yards than its opponent coming in a loss:
| UGA's yardage differential | Season | Opponent (winning score) | UGA's yardage | OPP's yardage |
|---|---|---|---|---|
|
+269 |
1995* |
Virginia (34-27) |
525 |
256 |
|
+250 |
2016 |
Vanderbilt (17-16) |
421 |
171 |
|
+227 |
2009 |
Kentucky (34-27) |
487 |
260 |
|
+214 |
1958 |
Florida (7-6) |
350 |
136 |
|
+187 |
1992 |
Tennessee (34-31) |
569 |
382 |
|
+183 |
1985 |
Georgia Tech (20-16) |
371 |
188 |
|
+166 |
1978** |
Stanford (25-22) |
504 |
338 |
|
+154 |
1954 |
Georgia Tech (7-3) |
237 |
73 |
Still, what makes the Bulldogs’ loss from a couple of days ago even more baffling is that unlike every one of the previous +100-yards-but-lost games, Georgia did not commit a single turnover against the Commodores. Of the previous 17 games, 16 times the Bulldogs lost at least two turnovers, and 12 times they committed at least three. In fact, of the previous seventeen +100-yards-but-lost games, Georgia averaged nearly four turnovers (3.88) with a turnover margin of nearly minus two and a half (minus-2.29).
So, what was the deal Saturday versus Vandy?
“You know what it is?” Coach Smart replied with a question during the post-game press conference. “Special teams. Penalties.”
Therefore, considering special teams and penalties, here are a couple more stats: After averaging 5.0 penalties in its first three games—all victories—the Bulldogs have committed exactly eight penalties in each of their last four games, three of which have resulted in a loss. What’s more, after Vanderbilt returned two kickoffs for 124 yards, Georgia has now allowed opponents to average 26.3 yards per kickoff return this year. This mark currently trails only the 1962 Bulldogs’ squad—a team which won only three of 10 games—when it yielded a 28.9 for the highest kick-return average allowed in a season in the modern era.